Wednesday, December 13, 2017

Setting up Telegram with NagiosXI or Nagios for notifications, the lazy admin’s guide


Hi all, been wayy way to long since i last updated and wrote in this blog. Been super busy and i hope you guys too have had a wonderful year as i had and super grateful for it :-)

Here’s a quick article for anyone wishing to integrate Telegram messaging to NagiosXI quick. Telegram is amazing, its free, its fast, its secure. Their API is also an official one (unlike Whatsapp)

CRITICAL NOTICE:
Take note, Telegram can sometimes go down, your internet can also go do, for some reason, Nagios server may not have access to internet, so it will not send Telegram messages, always use email or SMS as a backup.

What do you need? And what i assume..

  1. A NagiosXI installation that can access the internet at all times (as it sends to Telegram servers over the internet)
  2. Subscribe/register with Telegram (Mobile app Appstore, Play Store or Web - https://web.telegram.org/). A mobile number is required.
  3. I like to send to a group, so create a group called “NagiosAlerts” in your Telegram or any name that you like, do not use spaces or special characters please. Add at least one more person into that group (e.g. your team that has Telegram installed).  This guide assumes sending to that group “NagiosAlerts”, you can change that as per script (the send_telegram.sh script) below.
  4. This guide was based on Centos 7, i cannot imagine it too much different to Centos6 or RHEL6 / 7, modify the part of yum, that would be the only problematic one, if at all
  5. You have sufficient XI and linux commands know-how

Let’s begin, you’re a couple of steps away from Telegramming on NagiosXI!

This article assumes you’ve got XI installed already. So we can dive straight into the telegram setup bit. You can send messages many ways, you can use the bot method or use an actual Telegram user. I prefer to use the user way. Do it whichever way you’d like, this guide however is based on user and group.

Run from your Nagios CLI via SSH as root. Cut and paste where applicable. Italic items of course don’t cut and paste lah

  1. yum install lua-devel openssl-devel libconfig-devel readline-devel libevent-devel jansson-devel.x86_64 python-devel git -y
  2. cd /usr/src/
  3. git clone --recursive https://github.com/vysheng/tg.git
  4. mkdir /usr/local/nagios/telegram
  5. mv tg /usr/local/nagios/telegram
  6. cd /usr/local/nagios/telegram/tg
  7. ./configure
  8. make
  9. chown nagios.nagios /usr/local/nagios/telegram/ –R

Now, let’s test run it for the first time to perform registration as user nagios or whichever nagios user you have configured nagios for (usually “nagios”). Take note on the phone number format as explained below

  1. su nagios
  2. bin/telegram-cli -k tg-server.pub
  3. When asked for phone, enter your number e.g. +6012123456 (enter with country code and plus sign at the beginning). Try and use your company phone numbers so its “nothing personal”. You should receive a code via SMS or Telegram, enter the code correctly, then type quit to exit as mentioned below
  4. quit
  5. Type exit to go back as root (since you’re now user nagios@)

Now you’re done with telegram, time to setup send message script and let’s use a simple bash script to do that by copying and pasting items in the Courier New font (taken and modified from https://github.com/andy-partington/nagios-telegram/blob/master/telegram_message.sh). Once pasted, save and exit editor.

  1. vi /usr/local/nagios/libexec/send_telegram.sh .

  2. #!/bin/bash
    NAGMSG="$1"
    cd /usr/local/nagios/telegram/tg/
    (sleep 3; echo "msg NagiosAlerts '$NAGMSG'"; echo 'safe_quit';) | /usr/local/nagios/telegram/tg/bin/telegram-cli -W -k server.pub -v


  3. chmod +x /usr/local/nagios/libexec/send_telegram.sh && chown nagios:nagios /usr/local/nagios/libexec/send_telegram.sh

Test this now, by going in as user nagios

  1. su nagios
  2. /usr/local/nagios/libexec/send_telegram.sh 'Telegram With Nagios Rawks'
  3. exit

Now, access your XI Web UI, and its  time to configure telegram notification via XI. Paste items in bold when requested to, word for word! Only the ones in bold OK!

  1. In Core Configuration Manager, go to commands, create a new one, call it notify-host-by-telegramcli and the command paste this below
    $USER1$/send_telegram.sh "***** Nagios Monitor XI Alert *****\n\nNotification Type: $NOTIFICATIONTYPE$\nHost: $HOSTNAME$\nState: $HOSTSTATE$\nAddress: $HOSTADDRESS$\nInfo: $HOSTOUTPUT$\n\nDate/Time: $LONGDATETIME$\n"
  2. As for the type set it to “Misc Command”
  3. Click Save
  4. In Core Configuration Manager again, go to commands, create a new one, call it notify-service-by-telegramcli and the command paste this below
    $USER1$/send_telegram.sh "***** Nagios Monitor XI Alert *****\n\nNotification Type: $NOTIFICATIONTYPE$\n\nService: $SERVICEDESC$\nHost: $HOSTALIAS$\nAddress: $HOSTADDRESS$\nState: $SERVICESTATE$\n\nDate/Time: $LONGDATETIME$\n\nAdditional Info:\n\n$SERVICEOUTPUT$"
  5. Again, type  is “Misc Command”
  6. Click Save
  7. Click Apply Configuration and now you’re ready to add the notification type to relevant users, eg. nagiosadmin
  8. Modify the contacts to include (or exclusively use) telegram, select host for host, select service for service. Below is example of host and followed by service
    imageThis is for host

    imageThis is for service

  9. Save and apply. Go ahead and test by sending custom notification for a host or service where your configured contact will get messages, of course, that contact must be part of the contact that will receive notification for the respective service or host. If you can’t get messages, then its likely notification for that user you enabled isn’t using telegram method or something else isn’t right within Nagios notification logic. Check the relevant logs. See if its even sending to begin with…you should see something like below;
    SERVICE NOTIFICATION: nagiosadmin;localhost;Current Users;CUSTOM (OK);notify-service-by-telegramcli;USERS OK - 2 users currently logged in;Nagios Administrator;did i get this on telegram?

  10. Check logs with;
    tail -100 /var/log/messages

So you’re done. Easy peasy innit?

MERRY CHRISTMAS and HAPPY NEW YEAR. Many cheers from Astiostech too!

Monday, April 3, 2017

Per User PIN for FreePBX 2.x

This article shows how to very easily add a per-user pin for outbound calls using FreePBX systems. Sometimes trunk level isn’t too fun. Also, if you don’t want to use a specially created  DB, you can use FreePBX’s pin module and “Refer” to that PIN when verifying. That’s something i am not covering here.

Steps

1) Create Database/Tables

2) Insert dialplan

3) Create users in table

READ THIS NOW

  • In the dialplan be sure to change sqluser and sqlpass to your MySQL user and password allowed to at minimum do a SELECT to the above DB/table
  • These dialplans uses the default sound files from Asterisk distribution, change were you see fit, where the  “Playback” and “Read”  app uses as below
  • Iteration for wrong pin is 3 times
  • PIN length is 4 digits, change if you need larger, the size of the int(4) in DB to int(6) for example, then at the dialplan change 5 in the readpin line
  • Hang up if wrong pin
  • If pin defined, will use usual routes set, if route has a pin, user has to key in twice
  • Valid and Invalid pin attempts  are stored in CDR as accountcode
  • ISSUE: Billing seconds in Asterisk is counted when this app executed. If you do billing, this might be a problem, otherwise, don’t bother


Create Database/Tables

Simply run this sql query and it will add the necessary table/data. If not, here’s the schema below that.

--WARNING, THIS WILL DROP EXISTING DB/TABLE

DROP DATABASE IF EXISTS `custom_pin`;
CREATE DATABASE `custom_pin` /*!40100 DEFAULT CHARACTER SET latin1 */;
USE `custom_pin`;

DROP TABLE IF EXISTS `tbl_custom_pins`;
CREATE TABLE `tbl_custom_pins` (
  `user` int(4) NOT NULL,
  `pin` int(8) NOT NULL,
  `comment` varchar(200) NOT NULL
) ENGINE=MyISAM DEFAULT CHARSET=latin1;
 

Create a database called “custom_pin”, inside this DB, create a table called tbl_custom_pins

Add entries like below.

image


Insert dialplan

- Edit /etc/asterisk/extensions_custom.conf

- If you do not already or use macro [macro-dialout-trunk-predial-hook], create one like this, and add the following lines

[macro-dialout-trunk-predial-hook]

exten => s,1,Macro(custom-pins)


Now, we create the macro, custom-pins, copy paste the lines below

;; CUSTOM PIN START COPY HERE
[macro-custom-pins]
exten => s,1,NoOp(CUSTOM PIN MODULE - USE DATABASE TO DEFINE)
exten => s,n,Wait(1)
exten => s,n,Macro(app-custom-pin,s,1)
exten => s,n,MacroExit()

[macro-app-custom-pin]
exten => s,1,NoOp(CHECKING IF PIN ENABLED AND VERIFYING IF IT IS)
exten => s,n,Set(PINCOUNT=0)
exten => s,n,Set(ALLOWERROR=0)
exten => s,n,Gotoif($["${AMPUSER}"=""]?skip) ;;if not ampuser skip

exten => s,n,MYSQL(Connect connid localhost sqluser sqlpass  custom_pin)
exten => s,n,MYSQL(Query resultid ${connid} SELECT pin from tbl_custom_pins where user='${AMPUSER}' LIMIT 1)
exten => s,n,MYSQL(Fetch fetchid ${resultid} DBPIN)
exten => s,n,NoOp(DB Results spits out ${DBPIN} or ${VAR1})
exten => s,n,MYSQL(Clear ${resultid})
exten => s,n,MYSQL(Disconnect ${connid})
exten => s,n,GotoIf($["${DBPIN}"=""]?skip:readpin)

exten => s,n(readpin),Read(PIN,en/pin_number,,,1,5)
exten => s,n,Gotoif($["${PIN}"="${DBPIN}"]?pass)
exten => s,n,Playback(custom/invalid)
exten => s,n,Set(PINCOUNT=$[${PINCOUNT}+1])
exten => s,n,GotoIf($[${PINCOUNT}>2]?toomanyerros)
exten => s,n,Goto(readpin)

exten => s,n(skip),NoOp(NO PIN DEFINED)
exten => s,n,MacroExit()

exten => s,n(pass),NoOp(PIN IS OK)
exten => s,n,Playback(auth-thankyou)
exten => s,n,Set(CDR(accountcode)=${DBPIN})
exten => s,n,MacroExit()

exten => s,n(toomanyerros),Playback(en/an-error-has-occured)
exten => s,n,Playback(terminating)
exten => s,n,Set(CDR(accountcode)=PIN-ERR)
exten => s,n,Hangup(16)

;; END COPY HERE

Create Users

The app uses the variable {AMPUSER} which almost all the time is declared by FreePBX, it will not work if that’s missing! Meaning this could be from users detached from a device in device user mode. If {AMPUSER} is not found or not defined/zero value, the dialplan will also skip, allowing users to call out as usual. If defined, it will be checked against this {AMPUSER} variable and if match, it will ask for PIN, if there’s no DB match, it will proceed allowing users to call out like usual.

Remember, the user part in DB is the user defined as “User” in device user mode, but if its in (default) extensions mode, it will always be the same, meaning SIP/1000 will always be user 1000 as well.

Wednesday, December 21, 2016

Limiting calls by DIDs for FreePBX users, with dynamic configurable parameters (Repost)

Image Source: http://appcrawlr.com/android-apps/best-apps-restrict-access

So, we had this challenge by our customer to do this as they are using PRI and supporting multiple customers. Each customer needs to be limited to n number of channels on PRI. When they were using analog that was simply straightforward, its a physical line, so nothing much you can do about “limiting” it is limited by design!

The following guide allows you to limit calls based on

  • A single DID
  • A group of DIDs (in this guide the amount of DIDs per group is limited to 5, add more, improv as you wish)
  • Group DIDs will be a union meaning, if you have DID1 and DID2 with limit of 3 calls, at any one time either calls coming to those DIDs are added up and if exceed 3, it will hangup.

Anyway, here’s a quick how-to to give you an idea how to go about it. Improv as you see fit :-)

Requirements: (my system)

1) FreePBX 2.10 or 2.11
2) Asterisk 1.8 or higher
3) Dahdi based PRI or SIP or just about anything with the use of proper declarations (variables)
4) Use MySQL
5) Debian Wheezy
6) Adminer to run a few MySQL tasks such as creating db/tables, editing values in them etc…

So here’s how:

  1. Create a database inside MySQL called LIMITER
  2. Use adminer and paste the following codes to using the “SQL Command” feature

    USE ` LIMITER`;
    CREATE TABLE `tbl_didlimiter` (
    `group` int(255) NOT NULL AUTO_INCREMENT,
    `data` varchar(100) DEFAULT NULL,
    PRIMARY KEY (`group`)
    ) ENGINE=MyISAM DEFAULT CHARSET=latin1;

  3. Now, we will create a user superuser with password dbgod00, paste the following codes in SQL Command again

    CREATE USER 'superuser'@'localhost' IDENTIFIED BY ‘dbgod00';
    GRANT ALL PRIVILEGES ON LIMITER.* TO 'superuser'@'localhost';
    FLUSH PRIVILEGES;

  4. Now, we edit the dialplan, the most important part! Since i use FreePBX, we use the _custom.conf to add new hacks. So that’s exactly what we are doing here, copy and paste the codes into extensions_custom.conf, like below

    #nano /etc/assterisk/extensions_custom.conf

    ;; DIALPLAN START ;;

    ;; READ ME FIRST
    ;; copyleft sanjay@astiostech.com
    ;; 1. Set trunks to use from-pstn, from-dahdi, from-zaptel OR from-trunk contexts
    ;; 2. The bold highlights may need to be changed depending on what you see in the
    ;; channel variables, most cases we see either EXTEN or FROM_DID or even CALLERID(DNID)
    ;; 3. Be sure this value is available and matching each other, in my case, the value
    ;; ${EXTEN} eventually matches the value ${CALLERID(DNID)} and they must
    ;; 4. This only supports one unique DID entry in DB. IF there are multiple entries
    ;; by mistake or whatever, it will pickout the first result that returns only
    ;;
    ;; 5. Feel free to add more G numbers as shown below, right now its just 5
    ;; 6. Maxdefault is set for global when no DB definitions are found for that DID and its limit,
    ;; if you do not want blanket settings, simply set MAXDEFAULT to blank (as per default) if you want to set a global
    ;; limit then set it with MAXDEFAULT which then applies to
    all DIDs not set in DB.
    ;; Only when
    there’s a value found in DB then that DB value’s limits overrides maxdefault 

    [from-pstn-custom]
    exten => _X.,1,NoOp(Handling incoming to do cool stuff)
    same => n,Set(GROUP()=${EXTEN})
    same => n,Macro(didchoke)

    [macro-didchoke]
    exten => s,1,NoOp(Checking for incoming limits and applying if needed)
    exten => s,n,Set(MAXDEFAULT=””)
    exten => s,n,MYSQL(Connect connid localhost superuser dbgod00 LIMITER)
    exten => s,n,MYSQL(Query resultid ${connid} SELECT data from tbl_didlimiter where data like '%${CALLERID(DNID)}%' LIMIT 1)
    exten => s,n,MYSQL(Fetch fetchid ${resultid} DBRESULT)
    exten => s,n,MYSQL(Clear ${resultid})
    exten => s,n,MYSQL(Disconnect ${connid})

    exten => s,n,ExecIf($["${DBRESULT}"=""]?Set(DBRESULT=${CALLERID(DNID)})
    exten => s,n,GotoIf($["${DBRESULT}"=""]?exception)

    ;
    exten => s,n,Set(GROUPLIMIT=${CUT(DBRESULT,:,2)})
    exten => s,n,ExecIf($["${GROUPLIMIT}"=""]?Set(GROUPLIMIT=${MAXDEFAULT})
    exten => s,n,GotoIf($["${GROUPLIMIT}"=""]?exception)
    ;
    exten => s,n,Set(DIDS=${CUT(DBRESULT,:,1)})
    exten => s,n,Set(DID1=${CUT(DIDS,\,,1)})
    exten => s,n,Set(DID2=${CUT(DIDS,\,,2)})
    exten => s,n,Set(DID3=${CUT(DIDS,\,,3)})
    exten => s,n,Set(DID4=${CUT(DIDS,\,,4)})
    exten => s,n,Set(DID5=${CUT(DIDS,\,,5)})
    ;
    exten => s,n,ExecIf($["${DID1}"!=""]?Set(G1=${GROUP_COUNT(${DID1})}))
    exten => s,n,ExecIf($["${DID2}"!=""]?Set(G2=${GROUP_COUNT(${DID2})}))
    exten => s,n,ExecIf($["${DID3}"!=""]?Set(G3=${GROUP_COUNT(${DID3})}))
    exten => s,n,ExecIf($["${DID4}"!=""]?Set(G4=${GROUP_COUNT(${DID4})}))
    exten => s,n,ExecIf($["${DID5}"!=""]?Set(G5=${GROUP_COUNT(${DID5})}))
    ;
    exten => s,n,ExecIf($["${DID1}"=""]?Set(G1=0)
    exten => s,n,ExecIf($["${DID2}"=""]?Set(G2=0)
    exten => s,n,ExecIf($["${DID3}"=""]?Set(G3=0)
    exten => s,n,ExecIf($["${DID4}"=""]?Set(G4=0)
    exten => s,n,ExecIf($["${DID5}"=""]?Set(G5=0)
    ;
    exten => s,n,Set(TOTALGGROUPCHANS=$[${G1}+${G2}+${G3}+${G4}+${G5}])
    exten => s,n,NoOp(So total channels here are ${TOTALGGROUPCHANS} of GROUPLIMIT of ${GROUPLIMIT})
    exten => s,n,GotoIf($[${TOTALGGROUPCHANS} > ${GROUPLIMIT}]?overlimit)
    exten => s,n,MacroExit()
    ;
    exten => s,n(overlimit),Busy(20)
    exten => s,n,Hangup(16)
    exten => s,n,MacroExit()
    ;
    exten => s,n(exception),MacroExit()

    ;; DIALPLAN END ;;

  5. Now, reload asterisk dialplan, be sure to tail the log file to start troubleshooting if things don’t go right.
    #asterisk -rx “dialplan reload”
  6. Now, edit the DB values and add DIDs like show in example below, use adminer or similar for easy editing
    E.g. 1 Format: DID1:3
    Where DID1 is DID you wish to limit to 3 channels
    E.g. 2 Format: DID1,DID2,DID3,DID4,DID5:3
    Where DID1-5 are the DIDs you wish to limit to 3 channels combined

    Here’s sample data from my own server!
    image   

Fire away, test it out…! As usual, appreciate the feedback and ideas to improve! Do let us know how it went for you!

Monday, November 7, 2016

OPUS & VP8 Codec with Asterisk 11.20 or higher

We have started to use OPUS codec to deploy our remote peers and so far it sounds amazing with very little bandwidth which almost matches GSM in terms of bandwidth and sound quality is as good as 48khz MP3 files. This is the future of IP telephony, for sure! Newer versions of Asterisk (13++), already comes with  OPUS built straight into the core code from Asterisk folks. However, for Asterisk 11, we need to configure it manually. This article attempts to provide some guide to setting up OPUS on Asterisk 11.2x or higher. Since Asterisk 11.24.1 was just released, i will be using that version  as part of this guide and the latest stable build of of libopus from xiph.org.

Note: Tested this with 11.20 through 11.24.1

This is not a guide on how to install Asterisk. This guide assumes you’ve already got Asterisk up and running without problems and just want to get OPUS running.

All credit for the original Asterisk patch to meetecho and forked by xxsl for Asterisk 11.20 or higher support.

Ok, let’s get down to business.

  1. Get “autoconf”, “automake” “pkg-config”
    # (yum install) apt-get install autoconf automake pkg-config
  2. Get the latest libopus
    # cd /usr/src
    # wget //downloads.xiph.org/releases/opus/opus-1.1.3.tar.gz && tar –zxvf opus-1.1.3.tar.gz && cd opus-1.1.3
    # ./configure
    # make all && make install
  3. That should get your opus ready for asterisk installation. Since vp8 is merely passthru, it will not require any libraries. It will allow two or more VP8 capable peers to passthru video without transcoding.
  4. Now, lets get started on asterisk side, assuming you’ve got the Asterisk source in /usr/src/, your version must be 11.20 or higher up until 11.24.1
    # cd /usr/src/asterisk-11.24.1
    # wget http://www.orencloud.com/public/opuspatch-ast11.2x.patch
    # patch -p1 -u < opuspatch-ast11.2x.patch
    You should NOT see any “failed” message
  5. Now go ahead and recompile Asterisk
    # ./bootstrap.sh
    # make clean && ./configure --with-crypto --with-ssl --with-srtp=/usr/local/lib --prefix=/usr
    IMPORTANT: If you do not have libsrtp, leave only with “--prefix=/usr”, remove the rest in that line. Libcryto and ssl are used for SRTP (for WebRTC mainly)
    # make menuselect
    IMPORANT: Please be sure to select 1) Codec Opus in Codec Translations, 2) Format VP8 in Format Interpreters and for best compatibility, 3) all sounds that’s SLIN16 (not selected by default) in Core Sound Packages, MOH Packages and Extra Sound..
    IMPORANT: If you can’t select Opus something went wrong in your libopus installation!, otherwise it should be preselected for you, but do check nontheless
    FREEPBX USERS! IMPORTANT: FreePBX users, be sure to select format_mp3, res_config_mysql, app_mysql, app_saycountpl and cdr_mysql in Add-ons
    # save and exit
    FREEPBX USERS! IMPORTANT: Run this # contrib/scripts/get_mp3_source.sh
    # make && make install
  6. Now if you use freepbx, simple run #amportal kill && amportal start
  7. Otherwise, simply kill and start back Asterisk
  8. You should see opus in the translation list
    # asterisk -rx "core show translation"
  9. Also, if you go into asterisk cli, you could type opus <tab> and set debug…that all means the patch worked great, now to test!
  10. Be sure to set allow=opus in your sip general setting or per peer/user. For FreePBX users, go to FPBX UX and select Asterisk SIP settings, set allow opus/vp8 like below right at the bottom of that page.
     image
  11. Use a phone that supports OPUS (on Windows you’ve got Phoner, MicroSIP, on mobile you’ve got CCIPSimple or BRIA) and dial away to test
  12. Here’s my BRIA on my Android with Opus at 48Khz, dialing the echo test on FreePBX *43
    ss 
  13. You can also fine tune the codec settings in /etc/asterisk/codec.conf, here’s an example from my own PBX
    image
    More info on codec.conf is explained below
  14. codec.conf configuration snippets for Asterisk
  15. ; Default Custom OPUS format definitions, only one custom OPUS format

    ; per sample rate is permitted.

    [opus48]

    type=opus

    samprate=48000 ; Sample rate of this opus format in hz.

    ; 8000, 12000, 16000, 24000, 48000 are acceptable values.

    ;fec=true ; turn on or off encoding with forward error correction.

    ; On recommended, off by default.

    ;maxbitrate=10000 ; Use the table below to make sure a useful bitrate is chosen

    ; for maxbitrate. If not set or value is not within the bounds

    ; of the encoder, a default value is chosen.

    ;

    ; sample rate | bitrate range

    ; 8khz | 6000 - 20000 bps

    ; 12khz | 7000 - 25000 bps

    ; 16khz | 8000 - 30000 bps

    ; 24khz | 18000- 28000 bps

    ; 48khz | 24000- 32000 bps

    ;dtx=true ; Encode using discontinuous transmission mode or not. Turning this

    ; on will save bandwidth during periods of silence at the cost of

    ; increased computational complexity. Off by default.

    ;cbr=true ; Whether or not to encode with constant or variable bit rate. Constant

    ; bit rate is disabled by default.

    [opus16]

    type=opus

    samprate=16000

Friday, September 9, 2016

Telekom Malaysia (TM) Multi-Line SIP setup with vanilla Asterisk or FreePBX over TEL URI

Telekom Malaysia
Src: https://www.tm.com.my/Office/Business/SME/Solutions/Pages/Multi-Line-SIP.aspx

Happy to say that we’ve successfully set up Asterisk 11 or higher with TM’s Multi-Line SIP which basically uses IMS signaling on Huawei devices used by Telekom Malaysia.

We had to modify chan_sip.c and parser  files to support TEL: URI for INVITE messages. Currently, we have enabled it to support incoming INVITES only. TM doesn’t require to send TEL: uri for outgoing calls and the usual SIP: uri is perfectly fine.

There are several steps involved and i will blog about it later (when i have the time). Generally its

1) Getting the hack from here: http://forums.asterisk.org/viewtopic.php?f=1&t=76432

2) Adding one or two more TEL support in the parser file

3) Configure trunks and registration

4) Setup an incoming dialplan to chomp down parts of the SIP header to be used as CallerID and DID values respectively.

5) Enable ringing into all inbound routes

We successfully tested incoming, outgoing, transfers using standard codecs. The audio quality is nearly as good as PRI tho sometimes, takes a bit longer to handshake the INVITE messages but its hardly noticeable. We might be able to send messages too over regular IP or SMS, i think that’s why the IMS is chosen in the first place, to enable multimedia over voip protocols.

If you need help, write to us info@astiostech.com and if you use Asterisk in a non-commercial environment, i will set it up for free Winking smile

For more information on TM’s MLS: https://www.tm.com.my/Office/Business/SME/Solutions/Pages/Multi-Line-SIP.aspx

Have a good one.
Sanjay

Monday, June 6, 2016

The 60 minute Nagios Core 4 install guide on Debian 7 Wheezy (Nagios 4, PNP4Nagios -with MRTG & NagiosQL) built from source or just use the VM OVA2.0

Version 1.1 – 07 June 2016


NOTES:

  • Copyright and registered trademarks are the properties of their respective companies/individuals
  • By all means, these are not my own guides but a collection of guides online with my own hacks here and there that didn’t work for me and now they do. THANK YOU ALL THOSE RESPECTABLE BLOGGERS FOR THEIR CONTRIBUTION
  • I do not provide any warranty whatsoever for using this guide or the OVA2 images herein
  • This guide doesn’t include how to make Nagios work for you, that’s something you need to learn  this guide is just for how to get Nagios working, period.
  • Copy paste as single lines unless otherwise told, the – denotes to run on cli, copy paste them line by line after the dash space (- ), e.g. – apt-get update, copy “apt-get update” without the quotes and paste into your putty/ssh session.

Software & versions:

  • Nagios Core 4.1.1
  • Nagios plugins including community add-ons and check_nrpe
  • MRTG graphing engine to monitor Nagios itself.
  • PNP4Nagios 0.6 with RRD
  • NagiosQL 3.20 for Web GUI to edit and manage Nagios configs


VM Edition download:

If you’re not interested to do all of this below yet want to get Nagios 4.1.1 up and running, then download the OVA2 format VM image from Sourceforge: https://sourceforge.net/projects/debiannagios. Be sure to read the notes there.

Build by hand guide:

  1. Download and install the latest iteration of Debian 7 64bit netinst here: http://cdimage.debian.org/cdimage/archive/7.10.0/amd64/iso-cd/debian-7.10.0-amd64-netinst.iso
  2. Update and install a couple of packages, at one point the mrtg installation will a question, just press enter to continue.

    - apt-get update
    - apt-get upgrade

    - apt-get install --force-yes apache2 build-essential libgd2-xpm-dev libssl-dev exim4 heirloom-mailx wget apache2-utils curl daemon apt-file libnet-snmp-perl libperl5.14 libpq5 libfreeradius-dev libfreeradius2 libsensors4 libsnmp-base libtalloc2 libtdb1 libwbclient0 samba-common samba-common-bin smbclient snmp mrtg libmysqlclient-dev libcgi-pm-perl librrds-perl libgd-gd2-perl python build-essential ssh sudo expect linux-headers-`uname -r` curl sox apache2 libssl-dev libncurses5-dev bison subversion libnewt-dev libcurl4-openssl-dev libnet-ssleay-perl openssl libauthen-pam-perl libio-pty-perl vim iftop tcpdump iptraf ngrep strace ltrace lsof htop sysstat nmap dstat powertop ntpdate ntp ssh libdbi-perl libhtml-template-perl libnet-daemon-perl libterm-readkey-perl mysql-client mysql-common psmisc ethtool apt-show-versions libapt-pkg-perl libmyodbc whois libusb-dev  libdigest-md5-file-perl uuid-dev uuid screen autoconf automake git module-init-tools iotop iftop nmap unzip checkinstall libcgi-pm-perl librrds-perl libapache2-mod-python libapache2-mod-php5 php5-sqlite php5-mcrypt libgd2-xpm-dev libdbi1 libdbi-dev libapache2-mod-proxy-html snmp php5 libsnmp15 libnagios-plugin-perl php5-gd graphviz graphviz-dev php5-mysql sqlite3 libssh2-php fping smokeping screen

  3. Create users and groups (this use will also be used for apache, explain why later), place a password for user nagios, enter it twice

    - useradd nagios && passwd nagios
    - groupadd nagios
    - usermod -a -G nagios nagios
    - usermod -a -G nagios www-data

  4. Create some directories

    - mkdir /usr/local/nagios
    - mkdir -p /usr/local/nagios/share/{stylesheets,images}
    - chown -R nagios:nagios /usr/local/nagios

  5. Get Nagios core 4.11 and Nagios plugins

    - cd /usr/src
    - wget
    http://downloads.sourceforge.net/project/nagios/nagios-4.x/nagios-4.1.1/nagios-4.1.1.tar.gz
    - wget http://www.nagios-plugins.org/download/nagios-plugins-2.1.1.tar.gz
    - tar -xzvf nagios-4.1.1.tar.gz
    - tar -xzvf nagios-plugins-2.1.1.tar.gz

  6. Configure, make Nagios core

    - cd nagios-4.1.1/
    - ./configure --prefix=/usr/local/nagios --with-nagios-user=nagios --with-nagios-group=nagios --with-command-user=nagios --with-command-group=nagios
    - make all
    - make install
    - make install-init
    - make install-commandmode
    - make install-config
    - make install-exfoliation
    - make install-webconf

  7. Copy over some scripts (useful for SNMPTT, explained later)

    - cp -R contrib/eventhandlers/ /usr/local/nagios/libexec/
    - chown -R nagios:nagios /usr/local/nagios/libexec/eventhandlers
  8. Create your nagiosadmin user!, this will be the user you will use to login to the core web console via http://.
    - htpasswd -c /usr/local/nagios/etc/htpasswd.users nagiosadmin
  9. Nagios init file doesn’t fulfil some LSB requirements, so edit the init file and add two lines like this

    - nano /etc/init.d/nagios

    # Default-Start:      2 3 4 5
    # Default-Stop:       0 1 6


    image
  10. Alright, let’s restart apache for nagios web to work, set nagios to start automatically as well. Also, start the nagios core service. At this point, Nagios core is already installed, you can head over to http://<yourip>/nagios . Note, you may get check errors from the local services (localhost) that’s being monitored, that’s because we’ve not installed nagios plugins, yet. As long as you can see the webUI, that’s fine for now.

    - a2ensite nagios
    - service apache2 restart

    - ln -s /etc/init.d/nagios /etc/rc2.d/S20nagios
    - update-rc.d nagios enable

    - service nagios start
  11. Alright, let’s get the plugins installed now, after this is done, the web should show all plugins showing OK by right. You can recheck that if you want.

    - cd ..
    - cd nagios-plugins-2.1.1
    - ./configure --with-nagios-user=nagios --with-nagios-group=nagios --with-openssl=/usr/bin/openssl --enable-perl-modules --enable-libtap

    - make && make install

  12. Now, we will download and install NRPE just to get that binary to be used in almost all nagios agent based checks in your near future. After compiling, we will copy the binary to the libexec folder of Nagios.

    - cd ..
    - wget
    http://kent.dl.sourceforge.net/project/nagios/nrpe-2.x/nrpe-2.15/nrpe-2.15.tar.gz
    tar -zxvf nrpe-2.15.tar.gz
    - cd nrpe-2.15

    - ./configure --with-ssl=/usr/bin/openssl --with-ssl-lib=/usr/lib/x86_64-linux-gnu
    - make
    - cp src/check_nrpe /usr/local/nagios/libexec/
  13. You could also add some apt based contributed plugins like this below. This step is completely optional, though recommended. Note, this may install many other dependencies.

    - apt-get install nagios-plugins-contrib
    - cp -r /usr/lib/nagios/plugins/* /usr/local/nagios/libexec/

  14. Now, let’s get MRTG configured

    - cp /usr/src/nagios-4.1.1/sample-config/mrtg.cfg /usr/local/nagios/etc/
    - mkdir /usr/local/nagios/share/stats


    Edit the mrtg.cfg file and add a line right on the top of the file
    - nano /usr/local/nagios/etc/mrtg.cfg

    Add this to top of that file, save and exit.

    WorkDir: /usr/local/nagios/share/stats

    Run these at the command line.
    - env LANG=C mrtg /usr/local/nagios/etc/mrtg.cfg
    - indexmaker /usr/local/nagios/etc/mrtg.cfg --output=/usr/local/nagios/share/stats/index.html

    Now, we need to add the mrtg graphing to cron to run
    Create and edit a new crontab file, like below;

    - nano /etc/cron.d/nagiostats

    Paste this into that file, save and exit.
    */5 * * * *  root  env LANG=C /usr/bin/mrtg /usr/local/nagios/etc/mrtg.cfg
  15. Now, let’s go get pnp4nagios installed!, get rrdtool, download pnp4nagios and do the backend setup.

    - apt-get install rrdtool

    - cd /usr/src
    - wget -O pnp4nagios-0.6.25.tar.gz 
    http://downloads.sourceforge.net/project/pnp4nagios/PNP-0.6/pnp4nagios-0.6.25.tar.gz?r=https%3A%2F%2Fsourceforge.net%2Fprojects%2Fpnp4nagios%2F&ts=1464497035&use_mirror=pilotfiber

    - tar -zxvf pnp4nagios-0.6.25.tar.gz 
    - cd pnp4nagios-0.6.25
    - ./configure --with-rrdtool=/usr/bin/rrdtool

    - make all
    - make fullinstall
    - a2enmod rewrite
    - service apache2 restart

  16. Now, let’s enable a cool pnp4nagios popup graph like you see in NagiosXI

    - cp contrib/ssi/status-header.ssi /usr/local/nagios/share/ssi/
    - chown nagios:nagios /usr/local/nagios/share/ssi/status-header.ssi
    - chmod 644 /usr/local/nagios/share/ssi/status-header.ssi

  17. At this point, you need to access the pnp4nagios website http://<yourIP>/pnp4nagios and proceed with the instructions therein. Basically, everything should appear in green i.e. ALL GOOD, then, you can delete this install file

    - rm /usr/local/pnp4nagios/share/install.php
  18. Now, we will attempt to add a few definitions inside Nagios core configs to show our graphs, please follow these steps carefully and repeat for other services that produce performance data.

    - nano /usr/local/nagios/etc/nagios.cfg

    Paste the following at the end of the file. Everything is a single line

    process_performance_data=1
    service_perfdata_file=/usr/local/pnp4nagios/var/service-perfdata
    service_perfdata_file_template=DATATYPE::SERVICEPERFDATA\tTIMET::$TIMET$\tHOSTNAME::$HOSTNAME$\tSERVICEDESC::$SERVICEDESC$\tSERVICEPERFDATA::$SERVICEPERFDATA$\tSERVICECHECKCOMMAND::$SERVICECHECKCOMMAND$\tHOSTSTATE::$HOSTSTATE$\tHOSTSTATETYPE::$HOSTSTATETYPE$\tSERVICESTATE::$SERVICESTATE$\tSERVICESTATETYPE::$SERVICESTATETYPE$
    service_perfdata_file_mode=a
    service_perfdata_file_processing_interval=15
    service_perfdata_file_processing_command=process-service-perfdata-file
    host_perfdata_file=/usr/local/pnp4nagios/var/host-perfdata
    host_perfdata_file_template=DATATYPE::HOSTPERFDATA\tTIMET::$TIMET$\tHOSTNAME::$HOSTNAME$\tHOSTPERFDATA::$HOSTPERFDATA$\tHOSTCHECKCOMMAND::$HOSTCHECKCOMMAND$\tHOSTSTATE::$HOSTSTATE$\tHOSTSTATETYPE::$HOSTSTATETYPE$
    host_perfdata_file_mode=a
    host_perfdata_file_processing_interval=15
    host_perfdata_file_processing_command=process-host-perfdata-file

    image
  19. Next, enable the perf data command file

    - nano /usr/local/nagios/etc/objects/commands.cfg

    Paste the following at the end of that file as well

    define command {
            command_name process-service-perfdata-file
            command_line /bin/mv /usr/local/pnp4nagios/var/service-perfdata /usr/local/pnp4nagios/var/spool/service-perfdata.$TIMET$
            }
    define command {
            command_name process-host-perfdata-file
            command_line /bin/mv /usr/local/pnp4nagios/var/host-perfdata /usr/local/pnp4nagios/var/spool/host-perfdata.$TIMET$
            }

    image
  20. Here’s an important note, we need to enable these graphs inside either hosts or services that produces performance data. Usually, hosts will always produce such data if you use the standard host check commands, however, services depends on how it is configured and what the plugin returns. In our example, we will use localhost (the nagios server itself) as hosts and current user count as a service in which we want performance graphs to be generated.

    - nano /usr/local/nagios/etc/objects/localhost.cfg

    Under host localhost, locate hostname localhost, below address 127.0.0.1, add a line like this and as shown in the example below that as well.. This can be done for all hosts!

    action_url              /pnp4nagios/index.php/graph?host=$HOSTNAME$&srv=_HOST_' class='tips' rel='/pnp4nagios/index.php/popup?host=$HOSTNAME$&srv=_HOST_

    image

    Now, locate the “current users” service definition add a line like this as shown in the example below that as well. This can be used for all services that has performance data.

    action_url              /pnp4nagios/index.php/graph?host=$HOSTNAME$&srv=$SERVICEDESC$' class='tips' rel='/pnp4nagios/index.php/popup?host=$HOSTNAME$&srv=$SERVICEDESC$


    image

  21. Now, let’s verify if we have done the above correctly or not by running the pre-flight nagios check like this

    - /usr/local/nagios/bin/nagios -v /usr/local/nagios/etc/nagios.cfg

    It should show zero errors and zero warnings. If it doesn’t, you’ve made a typo or an error with the steps above.
    image
  22. Now, if all goes well as above, restart nagios process and start the npcd process, which is the nagios performance data service, we will also set the npcd to start at boot, after the restart, go back to the webpage and you should see some extra icons appearing infront of “localhost” and “current users”. Do not panic if you see errors or no performance data, give it like 10 to 30 minutes for it to generate some data.

    - service npcd start
    - update-rc.d npcd enable

    - service nagios restart
  23. Go ahead and add the same service and host perf data action url to other hosts or services you’ve created and perf graphs will appear in the main nagios page. If you don’t want to show it on that page, they will be automatically generated and you can access them via http://<yourIP>/pnp4nagios
  24. Now, let’s install NagiosQL, one of the many tools out there to perform edits on Nagios configs without having to touch text editors and what not.

    - cd /usr/src
    - wget -O  nagiosql_320.tar.gz
    http://downloads.sourceforge.net/project/nagiosql/nagiosql/NagiosQL%203.2.0/nagiosql_320.tar.gz?r=https%3A%2F%2Fsourceforge.net%2Fprojects%2Fnagiosql%2Ffiles%2Fnagiosql%2FNagiosQL%25203.2.0%2F&ts=1464465362&use_mirror=ufpr

    - tar -zxvf nagiosql_320.tar.gz

    - cp -R nagiosql32 /var/www/nagiosql
    - chown -R nagios:nagios /var/www/nagiosql

  25. Edit the timezone in php.ini. This is an important step to ensure NagiosQL knows when files were edited etc. Locate the date.timezone definition and define it by uncommenting it. Refer to this for a list of countries and how to write that definition. In my case, i am of course going to set it to Kuala Lumpur, Malaysia, where i live.

    - nano /etc/php5/apache2/php.ini

    date.timezone = Asia/Kuala_Lumpur

    image

    - service apache2 restart
  26. Create some directories in which NagiosQL will write all config files.

    - mkdir /usr/local/nagios/etc/nagiosql
    - chown -R nagios:nagios /usr/local/nagios/etc/nagiosql


    Now, let’s create a NagiosQL apache2 definition

    - nano /etc/apache2/sites-available/nagiosql

    Paste, this below, save and exit.

    Alias /nagiosql /var/www/nagiosql/

    <Directory /var/www/nagiosql/>
    Options None
    Order allow,deny
    allow from all
    </Directory>

    Load this config above and restart apache

    - a2ensite nagiosql
    - service apache2 reload

  27. Edit apache envvars to change apache from its default www-user to nagios, this will be useful for nagiosql to write stuff into nagios directories and control the nagios process.

    - nano /etc/apache2/envvars

    Change www: data to nagios for both user and group

    image

    - chown -R nagios:nagios /var/lock/apache2/
    - chown -R nagios:nagios /var/www/
    - chown -R nagios:nagios /var/lib/php5
    - service apache2 restart
  28. Get mysql and related files to for NagiosQL, at this point you will get prompted for the root password of mysql , please enter a valid password and remember it for later use during NagiosQL installation.

    - apt-get install mysql-server php5-mysql libmysqlclient15-dev
  29. Now, go to http://<yourIP>/nagiosql, it is important to note on these settings below
    - Click on START INSTALLATION (there should not be errors which will stop you from clicking next, if you see, “REFRESH” that means you’ve missed something above or its in error)
    - Click next
    - Modify accordingly and as show in the image below
    - DBserver type=mysql
    - dbserver=localhost
    - hostname=127.0.0.1
    - DBName=<leave default>
    - dbuser=<leave default>
    - dbpass=<leave default>
    - Admin user=root
    - Admin db pass = <password created during mysql installation>
    - Nagiosql user=admin
    - NagiosQL pass=<any password> & repeat
    - Import nagios sample = CHECKED
    - Create config paths = CHECKED
    - NagiosQL Config path = /usr/local/nagios/etc/nagiosql/
    - Nagios config path= /usr/local/nagios/etc/objects/


    Click on next and finish, you should not get any errors and it should land you to the login page. Important, please follow next guide before proceeding.
  30. Ensure we set the right permissions for NagiosQL

    - chgrp nagios /usr/local/nagios/etc/
    - chgrp nagios /usr/local/nagios/etc/nagios.cfg
    - chgrp nagios /usr/local/nagios/etc/cgi.cfg
    - chmod 775 /usr/local/nagios/etc/
    - chmod 664 /usr/local/nagios/etc/nagios.cfg
    - chmod 664 /usr/local/nagios/etc/cgi.cfg
    - chown nagios:nagios /usr/local/nagios/bin/nagios
    - chmod 660 /usr/local/nagios/var/rw/nagios.cmd
    - chown nagios:nagios /usr/local/nagios/var/rw/nagios.cmd

  31. Now, login to the NagiosQL page and edit the following

    Click on Administration, click on Config Target, click on modify for localhost (the wrench icon).
    Set the following;
    Method = Change to SSH, then enter your nagios user and password created at the beginning of this document.
    Nagios Command File=  /usr/local/nagios/var/rw/nagios.cmd
    Nagios Binary= /usr/local/nagios/bin/nagios
    Nagios Process file= /usr/local/nagios/var/nagios.lock
    Nagios config file/usr/local/nagios/etc/nagios.cfg

  32. Now,let’s modify Nagios core main config file to enable NagiosQL folders and disable the default one.

    Click on Tools, Nagios Config

    Disable / comment out the default ones by adding a # infront of them, like below
    #cfg_file=/usr/local/nagios/etc/objects/commands.cfg
    #cfg_file=/usr/local/nagios/etc/objects/contacts.cfg
    #cfg_file=/usr/local/nagios/etc/objects/timeperiods.cfg
    #cfg_file=/usr/local/nagios/etc/objects/templates.cfg

    #cfg_file=/usr/local/nagios/etc/objects/localhost.cfg

    image

    Add the following under config directories
    cfg_dir=/usr/local/nagios/etc/nagiosql/

    image

    Once done, click on Save.

    Now, click on Tools, Nagios Control.
    In the following order, click Write Monitoring Data, Click Write Additional Data, Click on Check Configuration Files (you should NOT have errors btw), and finally, click on Restart Nagios.

    For some reason, the import doesn’t really import the process-host-perfdata-file and process-service-perfdata-file commands definitions. Let’s add them otherwise, after the import, you may not get perf graphs working.

    Click on Commands, click on definitions. Click on Add, add like below
    Command: process-host-perfdata-file
    Command line: /bin/mv /usr/local/pnp4nagios/var/host-perfdata /usr/local/pnp4nagios/var/spool/host-perfdata.$TIMET$
    Rest leave as default. Click on Save.

    Click on Add, again.
    Command: process-service-perfdata-file
    Command line: /bin/mv /usr/local/pnp4nagios/var/service-perfdata /usr/local/pnp4nagios/var/spool/service-perfdata.$TIMET$
    Rest leave as default. Click on Save.

    Now, click on Write Config File.

    Click on tools, click on Nagios control, in the following order, click Write Monitoring Data, Click Write Additional Data, Click on Check Configuration Files (you should NOT have errors btw), and finally, click on Restart Nagios.
  33. Also, the action URLs go missing in the host and service we defined earlier. You can add it yourself in NagiosQL. Follow this to do bring it back into Nagios. Like shown above as an example, we will be adding the host=localhost and service=current users back into Nagios perf data.

    To add for a sample host.
    Click on Supervision, click on Host. Click to edit localhost (wrench icon). Click on Addon Settings, add the following line in Action URL:
    /pnp4nagios/index.php/graph?host=$HOSTNAME$&srv=_HOST_' class='tips' rel='/pnp4nagios/index.php/popup?host=$HOSTNAME$&srv=_HOST_

    Click on Save.

    Now, to add for a sample service.
    Click on Supervision, click on Service, search for “Current Users”. Click to edit (wrench icon). Click on Addon Settings, add the following line in Action URL:
    /pnp4nagios/index.php/graph?host=$HOSTNAME$&srv=$SERVICEDESC$' class='tips' rel='/pnp4nagios/index.php/popup?host=$HOSTNAME$&srv=$SERVICEDESC$

    Click on Save.

    Now, click on Write Config File.
    Click on tools, click on Nagios control, in the following order, click Write Monitoring Data, Click Write Additional Data, Click on Check Configuration Files (you should NOT have errors btw), and finally, click on Restart Nagios.
  34. You might also want to delete the sample hosts and definitions created by NagiosQL, use NagiosQL to delete them in the order of deleting services, followed by the sample hosts. You can do bulk deletion for hosts or services like shown in the image below. Warning, do not delete localhost and localhost related services.

    image

    Now, click on Write Config File.
    Click on tools, click on Nagios control, in the following order, click Write Monitoring Data, Click Write Additional Data, Click on Check Configuration Files (you should NOT have errors btw), and finally, click on Restart Nagios.

    This should leave you with the samples created by Nagios core installation monitoring Nagios itself.
  35. Let’s create some nice HTTP links to access a few tools we just created

    - nano /usr/local/nagios/share/side.php

    Locate the “General” section, add the following lines after the final </div> of that section. Paste these texts below, literally below that.

    <div class="navsection">
            <div class="navsectiontitle">Add-ons</div>
            <div class="navsectionlinks">
                    <ul class="navsectionlinks">
                            <li><a href="/nagios/stats" target="<?php echo $link_target;?>">Nagiostats</a></li>
                            <li><a href="/pnp4nagios" target="<?php echo $link_target;?>">Nagiosgraph</a></li>
                            <li><a href="/nagiosql" target="<?php echo $link_target;?>">Nagios Configurator</a></li>
                            <li><a href=http://www.astiostech.com target="<?php echo $link_target;?>">Nagios Support</a></li>
                            <li><a href=highsecurity.blogspot.com target="<?php echo $link_target;?>">Nagios Core 4.1.1 Install Guide</a></li>
                    </ul>
            </div>
    </div>


    Example like below;
    image

  36. Finally, refresh your /nagios page in your browser [F5] and see those links like below

    image
  37. Other stuff (And addons for future blog posts)
    - Be sure to configure periodic timesync
    - Install adminer to manage DB if required
    - Install MK livestatus to replace NDO
    - Install mod_gearman to replace Nagios default broker modules
    - Install Nagvis for visualization (and Install ndo2db for it or MK livestatus)

We hope this guide has helped you get your Nagios awesome monitoring tool up and running. Thank you and as usual, we’d appreciate feedbacks.

Friday, April 29, 2016

Increasing the maximum number of selectable fields in vTiger 6.0 report module

Image source: open4businessonline.com

Just wanted to share this out for those who may have run into this problem where you couldn’t add more than 25 fields in the built-in report module of vTiger.

  • My configuration:
  • CentOS 6
  • vTiger community 6.X

Simply edit the file

vtigercrm/layouts/vlayout/modules/Reports/resources/Edit2.js

Locate the text maximumSelectionSize and change from 25 to whatever you need, this particular config below was from a client that needed more than 200 fields in their reports.

image

That should be it, just reload the reports page and voila! more than 25 (ignore the text that says max 25 or change it if you want)

Shoutout to our client that found the solution, Mr. Benjamin Lim and Mr Au Yong from CustomerConnect Malaysia, with their R&D deep into Google, we added this hack, thanks guys!

Tuesday, April 12, 2016

Decoding Oreka’s MCF file extensions for generic playback software (e.g. vlc)

Here’s a quick howto guide to extract .mcf files that are the created by Oreka’s open source recording platform.


Parts of software and guides are taken off various sources from the internet. The decoder was written in c++

and is available here if you want to compile it yourself: https://www.dropbox.com/s/09eo986gc3sons8/orekadecoder.rar
Thanks to Juan Ramirez for writing the code.

 
Since i’ve compiled the cpp file, i will just expose the .exe for 64bit systems. If you need the 32bit platform, 
you need to compile it yourself. So, for you get started, you will need the following tools and software:
1) The orekadecoder.exe here http://www.orencloud.com/public/orekadecoder.zip, download and extract the file 
into anywhere, e.g. C:\tmp
2) Download and Install Audacity  http://www.audacityteam.org/download/ so we can combine, pitch change etc the files
3) If your the files you are converting is encoded into g729, you need an extra step and software, get it from 
here: http://www.codecpro.com/LicenseG729.php and extract the files (g729 steps and use here is for education
purposes only, you should normally buy a proper license) 
 

Steps

Step 1

1) Place the mcf file into C:/tmp, now we shall extract the .mcf file using orekadecoder.exe, here’s how
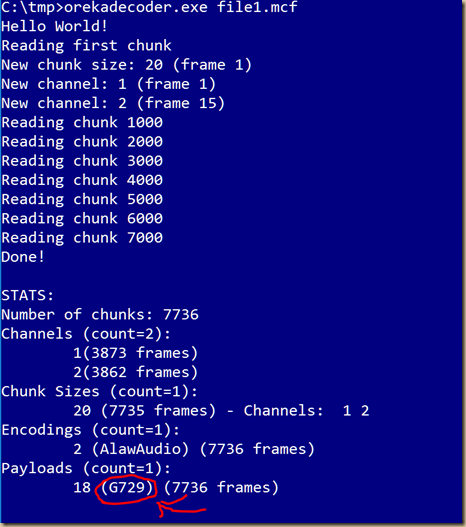
In this example, i have two files, file1.mcf and file2.mcf. Let’s split out file1.mcf first:
 
File 1 – Splitout – a g729 encoded file
image
and this created two files, like below
image
 
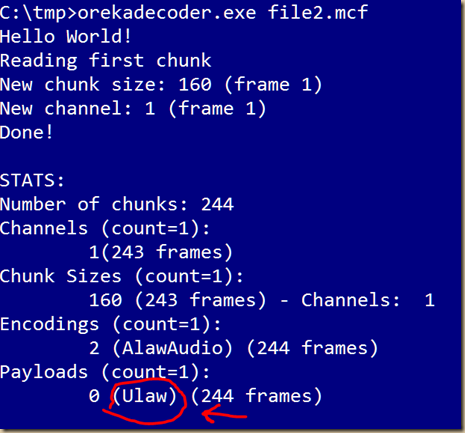
File 2 – Splitout – a ulaw encoded file, this file doesn’t need step 2, just go to step 3
image
The above files out1 and out2 basically mean the left and right channels. 
If you notice the above sample, the file is actually decoded as g729, 
so we need to decode that, as below
 

Step 2

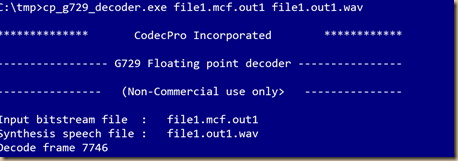
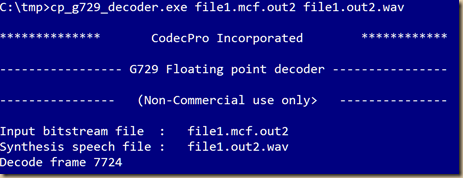
Decode the file1.mcf.out1 and file1.mcf.out2 into 

Copy out the file cp_g729_decoder.exe downloaded from codecpro.com, if its another directory into
c:\tmp so its easier to work. Now, convert out1 and out2 like this


Out1

image

Out2

image

Now in that folder, you will end up with file1.out1.wav and file1.out2.wav, proceed to step 3.
For those not needed to decode using g729 decoder, you can simply use the .out1 and .out2

files to import into audacity.


Step 3

Import into audacity and combine left and right audio

First example, we will use the .wav files instead of the .out1 or out2 files (we start with the g729 files)


g729 encoded file

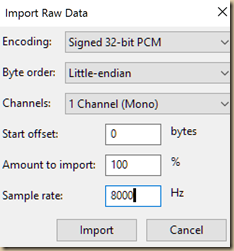
Open Audacity, click on file, click on Import, then click on Raw Data, when prompted open the first file,
i.e. in this example file1.out1.wav, set the import parameters like shown below;

image

Repeat this step for file1.out2.wav

Now, you should get two channels shown in Audacity, like below

image


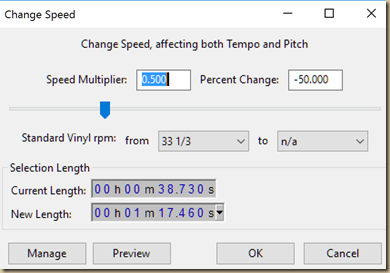
Now, since the conversion happened, the seem to be off, reduce the speed by 50%. Here’s how, click on Effect,

Change Speed Use the following setting

image

Note on the percentage, change it to –50 (minus 50) and that should be it, now save the file to any format you like.


Non-g729 file

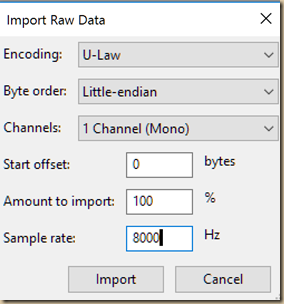
Now, for the ulaw file, we just need to import it directly into audacity with the same steps above except you

do not need to change the speed,  it should work straight away.Remember, import as raw.

Remember, we set the Encoding according to the output as seen in step 1

image


Then import the 2nd file as the other channel.

Note, you may not have audio in the 2nd file or the first file depending if its a mono recorded or stereo recorded channel.
Save the file to whatever format and you’re done.


Cheers.

My first ever Webminar On Windows 10 Security

Check it out if you’ve got some time to kill.

SRC: https://channel9.msdn.com/Events/Windows-10-Webinar-Series/Webinar-4-Windows-10-security

Snippet

We live in a new era of cyber threats. As employees work across multiple devices, data has never been more vulnerable. Windows 10 responds to the new ways people work: it helps you secure devices and data with sophisticated new tools.

We will introduce you to Microsoft Passport, which replaces passwords with strong, two-factor authentication that consists of an enrolled device and a Windows Hello (biometric) or PIN. And we will show you Device Guard, which prevents unauthorized applications from installing on your devices.

Another highlight is the latest version of BitLocker. Available with Windows Enterprise Software Assurance, BitLocker enables you to stop data being extracted from devices that are lost or stolen.

Speaker: Sanjay Stephen (Malaysia)
MVP in Security since 2009. He runs his own solutions implementation business.

Saturday, March 5, 2016

Check script for FreePBX-Asterisk realtime and CDR for suspicious calls (Nagios compatible)


image source:: http://www.chanakyadetective.com/software-investigation.html

Here’s a simple script we wrote to check real-time calls and historical data of n minutes in CDR for suspicious activities based on a number pattern and length. We find this utmost useful especially when your servers are exposed to public to check against hack attempts, abuses or checking matching numbers to “catch” and report. The current action sends email, of course, you can build more functions as you please and run them at each EXIT code in the script appropriately doing stuff like seen in the script for sending email. You need the local mailer program, called mail to be able to send emails from CLI already for the email function to work, otherwise, it may just output via CLI.

This  script has been tested on Debian, FreePBX 2.11 and Asterisk 11. It should work on most regular platforms as well as distros.  I’ve tested on Nagios Core, NagiosXI, Icinga, Icinga2.0.

This script basically does the following;

  • Its all bash, so should be quite compatible with many systems
  • It checks the CDR for n minutes of past records also set by flags
  • It checks asterisk current channels for external numbers only
  • It combines both results as a “total” value to evaluate with the given parameters
  • Uses filters based on the dst column on your CDR to match that you specify during execution (the parameters), this can be prefixes or whole numbers, and as many patterns as you want to check on a single run.
  • You can set the flag to check the prefix and the number of digits which is same or greater so that you won’t catch local calls, normally international calls have higher number of called digits, I.e. > 10
  • To automatically check or do it almost real-time, you can use cron on your server locally (It can also work with Nagios too, however, this guide does not cover configuring on Nagios,you need to set the flag NAGIOSMODE=YES). If you set Nagiosmode, it will not independently send out email and instead your Nagios server will decide what to do according to what you’ve set it to.
  • Be sure to change NAGIOSMODE, SYSADMINEMAIL,EMAILSUBJECT,USER,PASS and if needed, db port,db database name,db table name, and db server & also location of your binaries (find them by typing whereis asterisk and whereis mysql and whereis curl)
  • In some distro (FreePBX distro) the MySQL has no password (yeah, i know!), so in this case, leave the PASS=”” will suffice.

Setup:

  • cd /usr/local/bin/
  • wget http://www.orencloud.com/public/checkintl.sh
  • Modify the parameters as described below and/or in the script
  • Make the script executable and test  (chmod +x /usr/local/bin/checkintl.sh) Test : /usr/local/bin/checkintl.sh --help
  • You can run it like example below and/or put it up as a cronjob if you wish to automate checking (crontab –e), e.g. like this     */15 * * * * /usr/local/bin/checkintl.sh -w 3 -c 10 -i 60 -p 00:6,900:6
  • When adding complex scripts that call many functions be sure to test your cron output, here’s an easy way to see the output of cronjob in syslog (/var/log/syslog) by simply adding adding  2>&1 | /usr/bin/logger  -i  -t ASTIOSALERTS at the end of the script, like shown below
    • */15 * * * * /usr/local/bin/checkintl.sh -w 3 -c 10 -i 60 -p 00:6,900:6 2>&1 | /usr/bin/logger –i -t ASTIOSALERTS
  • Then tailf your syslog to see the output, it should not throw errors but should show you outputs.
  • Above cronjob does the checks for every 15 minutes, 60 minutes of records from bottom of the CDR table and warns on 3, critical on 10 for pattern matching front digits 00, with length greater than or equals 6 numbers and for pattern 900 with length greater than or equals 6 numbers
  • Always test manually. You surely can run this manually and try to invoke the trigger by making n number of calls and you should get an email alert based on the email address you specified
  • This script requires a MySQL CDR for Asterisk (therefore making it perfect for use with FreePBX, out of the box)
  • Set these below before running the script
      • Be sure to set the following inside the script (edit it)

        NAGIOSMODE="NO"
        SYSADMINEMAIL=SOMEONE@SOMEWHERE.COM,SOMEONE2@SOMEWHERE2.COM
        EMAILSUBJECT="HOST $MYHOST INTERNATIONAL CALLS ALERT"
        user="DBUSERNAME"
        pass="DBPASSWORD"

        MYCURL=/usr/bin/curl
        MYSQLBIN=/usr/bin/MySQL
        MYAST=/usr/sbin/asterisk

      • If using Nagios, just set the flag NAGIOSMODE=YES

    Run examples:

    /usr/local/bin/checkintl.sh -w 3 -c 10 -i 60 -p 00:10,900:10

    In the above example, it will

    -w 3 – Warn when both CDR and running channel defined patters is equal to or greater than 3

    -c 10 – Throw critical alert when both CDR and running channel defined patters is equal to or greater than 10

    -i 60 – Check CDR for a total time of 60 minutes (note, time on server needs to be accurate for this to work properly)

    -p 00:6,900:6 – This means, check for pattern 00 and 900 in the dst fields. If it exist, check length of >= 6 digits at minimum on both cases, in this example

    Sample outputs

    image

    No calls/threshold not hit like above


    image

    With a warning out which sends email when NAGISOMODE=NO. Also, if critical , it will send out emails like above.


    image

    image

    In Nagios mode, it will show up just like this above in CLI and in Nagios itself, it will look like this

    image

  • Email

    image


    As usual, do give us feedback if find bugs and/or improvements/suggestions. Do give it a try and comment please if you found something helpful for others to note on your findings.  Thanks and happy weekend.